
Uncover the revenue impact of loyalty programs
Built from over 12 years of LoyaltyLion data, covering 250M+ shoppers and 10k+ programs. These benchmarks show the real cumulative revenue generated by loyalty activity.
No projections here. We’re giving you the live performance data from thousands of active LoyaltyLion programs.
Includes revenue driven by referrals, loyalty components, email & SMS, and repeat purchases from redeeming members so that you can see the full impact over time.
Benchmarks are segmented by industry and revenue range so you can drill into the data relevant to you.
12+ years of data across 250M+ shoppers and 10k+ programs. Results are representative of all programs, not just the top performers.
Explore the real cumulative revenue generated by loyalty activity, segmented by industry and annual sales band.
* Average program: Most brands following basic best practices achieve these results with LoyaltyLion. † High-performing program: Brands following our guidance and fully optimizing advanced features achieve these results with LoyaltyLion.
EBOOK
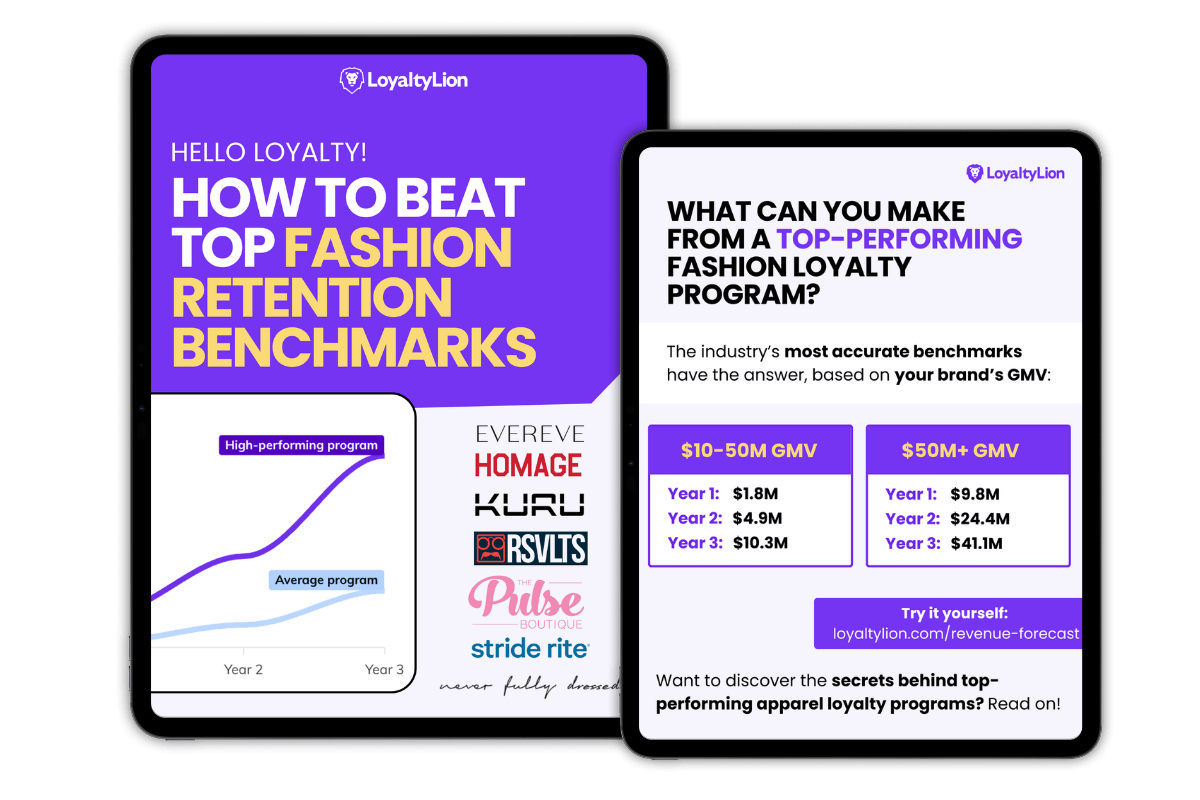
See how leading apparel brands drive 18–51% of revenue through loyalty — and what that could mean for your GMV.
Inside this report:
Revenue benchmarks by GMV tier ($10–50M and $50M+)
Real examples from Pulse Boutique, Evereve, KURU & more
The 7 loyalty tactics driving 20–31% of total revenue
Tactical breakdowns you can implement immediately
See your potential loyalty revenue in seconds. Simply plug in your store data to view your personalized forecast. Results are based on benchmarks from 10k+ real loyalty programs.
Calculate now









© Copyright 2026. All rights reserved.
